이번에는 둘째 날 배운 내용을 리뷰해보겠다. 둘째 날에는 이미지 분류 이론, Azure Cloud GPU활용, Cifar10 이미지 분류에 대해서 배웠다.
Convolutional Neural Network(CNN) 딥러닝이나 머신러닝 관련 자료들을 보면 자주 등장하던 CNN이다. 주로 이미지를 학습시킨다고 하면 제일 먼저 떠오르는 단어이다.
CNN(합성곱 신경망)은 필터링 기법을 인공신경망에 적용함으로써 이미지를 더욱 효과적으로 처리하기 위해 고안되었다. 이미지를 Dense(fully connected) Layer로 처리하려 한다면 feature가 너무 많아져 불필요한 weight가 많아지고 효율이 떨어지게 된다. 또한 Dense Layer는 1차원 데이터만 input으로 받을 수 있기 때문에 3차원 데이터를 평탄화하여 입력해야 한다. 여기서 3차원 데이터의 공간적 정보가 소실되는 문제가 발생한다. 반면 Convolutional Layer에서는 형상을 유지한다. 입/출력 모두 3차원 데이터로 처리하기 때문에 공간적 정보를 유지할 수 있다.
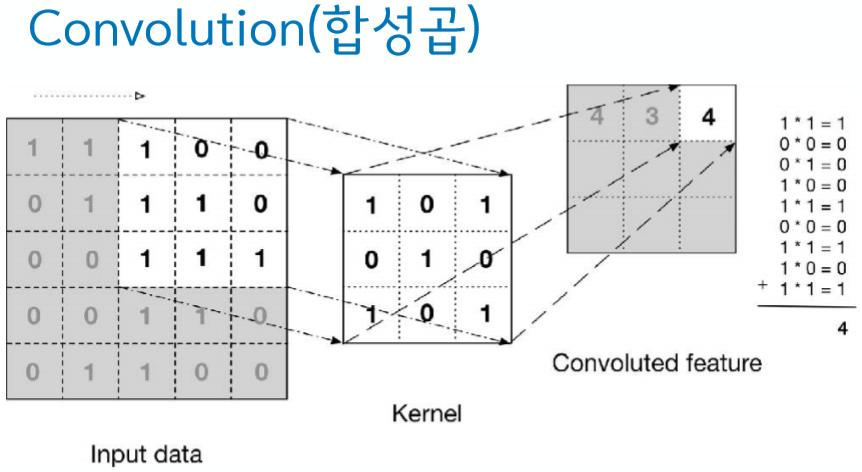
Convolutional Layer Convolution은 합성곱이라는 뜻이다. 최근에 영상처리 수업을 들으며 등장했던 단어이기 때문에 이해가 잘 되었다. 특정한 크기의 필터를 사용하여 이미지의 각 픽셀을 지나가며 필터의 위치에 해당하는 픽셀과 모두 곱한 후 그 곱한 값을 모두 더하여 현재 중앙 픽셀 값에 넣어주는 것이다.
위의 그림처럼 이미지에서 합성곱이란 필터를 이동시켜가며 이미지와 곱한 결과를 모두 더하는 것인데, 이러한 필터를 어떤 값을 넣어 사용하느냐에 따라 이미지의 색상, 밝기, 엣지 추출등 여러가지 기능을 수행할 수 있다. 또한 필터는 주로 커널이라고 부르기도 한다.
padding 1만큼 패딩했다고 한다면, 입력 데이터 사방 1픽셀을 특정 값으로 채워 늘리는 것을 말한다. 주로 출력 크기를 조정할 목적으로 사용되는데 이를테면 (5, 5)데이터에 (3, 3)필터를 적용하면 출력이 (3, 3)이 된다. 이처럼 합성곱 연산을 거칠 때 마다 크기가 작아지게 되는데 출력 크기가 너무 줄어드는 것을 막기 위해 패딩을 사용한다. 패딩을 사용하면 그만큼 입력 데이터를 그게 만들어 출력 데이터를 입력 데이터와 동일한 형상으로 조정할 수 있으므로 입력 데이터의 공간적 크기를 고정한 채로 다음 계층에 전달할 수 있다.
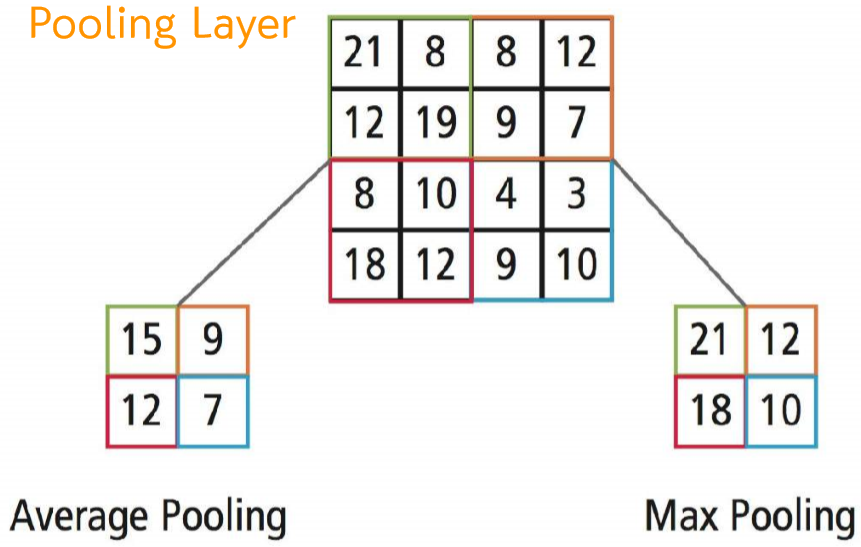
Pooling layer 풀링은 가로/세로 방향의 공간을 줄이는 연산이다. 풀링의 종류로는 Max Pooling과 Average Pooling이 있는데 이미지 인식 분야에서는 주로 Max Pooling을 사용한다.
Average pooling : 지정된 구역의 평균값을 가져와 대체함
Max pooling layer: 지정된 구역의 가장 큰 값을 가져와 대체함(사소한 정보 차이는 무시)
이미지가 가지는 큰 특징을 유지하며 사이즈를 줄임 (특징 일반화 가능)
예를 들어 강아지의 종이 다른 경우에도 큰 특징만 가지고 커버가능
데이터가 지역적으로 학습되지 않도록 함
실습1 첫번째는 간단하게 이미지만 불러와서 확인하는 과정이다.
2019.11.24. 딥-러닝 과정 CNN 준비 실습. Image 살펴보기 1 2 3 4 5 6 7 8 9 10 11 12 13 14 15 image_gray = Image.open('01image.png' ) image_color = Image.open('02image.png' ) image_jet = Image.open('jet.png' ) print(image_gray.size) print(image_gray) print(image_color.size) print(image_gray.size)
(28, 28)
<PIL.PngImagePlugin.PngImageFile image mode=L size=28x28 at 0x1405C55AE08>
(32, 32)
(28, 28)1 2 3 4 5 6 7 8 9 10 11 12 13 14 15 16 17 18 import numpy as npimage_array = np.array(image_gray) image_array_color = np.array(image_color) print(image_array.shape) print(image_array_color.shape) reshpaed_1d = image_array.reshape(28 *28 ) reshaped_3d = image_array.reshape(28 , 28 , 1 ) print(reshpaed_1d.shape) print(reshaped_3d.shape)
(28, 28)
(32, 32, 3)
(784,)
(28, 28, 1)1 2 3 4 5 6 print(image_array_color)
[[[125 125 116]
[110 101 91]
[102 90 83]
...
[202 207 214]
[200 205 212]
[202 208 214]]
...
[143 117 82]
[143 116 84]
[144 116 86]]]1 2 3 4 5 6 import matplotlib.pyplot as pltplt.imshow(image_array, cmap=plt.cm.gray) plt.imshow(image_array_color)
<matplotlib.image.AxesImage at 0x1405c59de48>실습2 두번째 실습은 CNN모델을 적용하기 전에 MLT만 사용하여 이미지를 학습시켜보았다. MLT는 1차원 데이터만 input으로 받을 수 있기 때문에 gray scale의 2차원 데이터는 1차원으로 reshape을 해주어야 학습이 가능하다.
2019.11.24. 딥-러닝 과정 CNN 첫번째 실습. Keras 모델 생성/학습 - MNIST : MLP Keras Dataset
1 2 3 4 5 6 7 8 9 10 from keras.datasets import mnist (X_train, y_train), (X_test, y_test) = mnist.load_data() print(X_train.shape) print(y_train.shape) print(X_test.shape) print(y_test.shape)
(60000, 28, 28)
(60000,)
(10000, 28, 28)
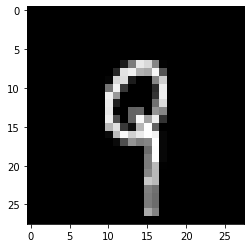
(10000,)1 2 3 4 5 6 import matplotlib.pyplot as pltimage = X_train[1 ] plt.imshow(image, cmap=plt.cm.gray)
<matplotlib.image.AxesImage at 0x12a2b101c48>(60000, 28, 28)1 2 3 4 5 6 7 8 9 X_train = X_train.reshape((60000 , 28 * 28 )) X_test = X_test.reshape((10000 , 28 * 28 )) print(X_train.shape) print(X_test.shape) print(X_train)
(60000, 784)
(10000, 784)
[[0 0 0 ... 0 0 0]
[0 0 0 ... 0 0 0]
[0 0 0 ... 0 0 0]
...
[0 0 0 ... 0 0 0]
[0 0 0 ... 0 0 0]
[0 0 0 ... 0 0 0]]1 2 3 4 5 X_train = X_train / 255.0 X_test = X_test / 255.0 print(X_train[9 ])
[5 0 4 1 9 2 1 3 1 4]1 2 3 4 5 6 7 from keras.utils import to_categoricaly_train = to_categorical(y_train) y_test = to_categorical(y_test) print(y_train[:10 ])
[[0. 0. 0. 0. 0. 1. 0. 0. 0. 0.]
[1. 0. 0. 0. 0. 0. 0. 0. 0. 0.]
[0. 0. 0. 0. 1. 0. 0. 0. 0. 0.]
[0. 1. 0. 0. 0. 0. 0. 0. 0. 0.]
[0. 0. 0. 0. 0. 0. 0. 0. 0. 1.]
[0. 0. 1. 0. 0. 0. 0. 0. 0. 0.]
[0. 1. 0. 0. 0. 0. 0. 0. 0. 0.]
[0. 0. 0. 1. 0. 0. 0. 0. 0. 0.]
[0. 1. 0. 0. 0. 0. 0. 0. 0. 0.]
[0. 0. 0. 0. 1. 0. 0. 0. 0. 0.]]1 2 3 4 5 6 7 8 9 10 11 12 13 from sklearn.model_selection import train_test_splitX_train, X_val, y_train, y_val = train_test_split(X_train, y_train, test_size=0.2 , random_state=9 ) print(X_train.shape) print(y_train.shape) print(X_val.shape) print(y_val.shape)
(48000, 784)
(48000, 10)
(12000, 784)
(12000, 10)1 2 3 4 5 6 7 8 9 from keras.models import Sequentialfrom keras.layers import Densemodel = Sequential() model.add(Dense(512 , input_dim=784 , activation='relu' )) model.add(Dense(10 , activation='softmax' )) print(model.summary())
Model: "sequential_6"
_________________________________________________________________
Layer (type) Output Shape Param #
=================================================================
dense_9 (Dense) (None, 512) 401920
_________________________________________________________________
dense_10 (Dense) (None, 10) 5130
=================================================================
Total params: 407,050
Trainable params: 407,050
Non-trainable params: 0
_________________________________________________________________
None1 2 3 4 model.compile(loss='categorical_crossentropy' , optimizer='sgd' , metrics=['accuracy' ])
1 2 3 4 5 6 7 8 9 10 batch_size=128 epochs=10 history = model.fit(X_train, y_train, epochs=epochs, batch_size=batch_size, validation_data=(X_val, y_val), verbose=1 )
Train on 48000 samples, validate on 12000 samples
Epoch 1/10
48000/48000 [==============================] - 2s 37us/step - loss: 1.2137 - accuracy: 0.7386 - val_loss: 0.6995 - val_accuracy: 0.8526
Epoch 2/10
48000/48000 [==============================] - 2s 34us/step - loss: 0.5725 - accuracy: 0.8683 - val_loss: 0.4960 - val_accuracy: 0.8789
Epoch 3/10
48000/48000 [==============================] - 2s 42us/step - loss: 0.4501 - accuracy: 0.8855 - val_loss: 0.4243 - val_accuracy: 0.8904
Epoch 4/10
48000/48000 [==============================] - 2s 40us/step - loss: 0.3967 - accuracy: 0.8948 - val_loss: 0.3847 - val_accuracy: 0.8984
Epoch 5/10
48000/48000 [==============================] - 2s 40us/step - loss: 0.3648 - accuracy: 0.9019 - val_loss: 0.3599 - val_accuracy: 0.9035
Epoch 6/10
48000/48000 [==============================] - 2s 40us/step - loss: 0.3425 - accuracy: 0.9064 - val_loss: 0.3419 - val_accuracy: 0.9077
Epoch 7/10
48000/48000 [==============================] - 2s 38us/step - loss: 0.3257 - accuracy: 0.9103 - val_loss: 0.3276 - val_accuracy: 0.9109
Epoch 8/10
48000/48000 [==============================] - 2s 40us/step - loss: 0.3121 - accuracy: 0.9145 - val_loss: 0.3155 - val_accuracy: 0.9133
Epoch 9/10
48000/48000 [==============================] - 2s 41us/step - loss: 0.3006 - accuracy: 0.9174 - val_loss: 0.3064 - val_accuracy: 0.9160
Epoch 10/10
48000/48000 [==============================] - 2s 40us/step - loss: 0.2906 - accuracy: 0.9201 - val_loss: 0.2977 - val_accuracy: 0.91831 2 3 4 test_loss, test_acc = model.evaluate(X_test, y_test) print(test_loss, test_acc)
10000/10000 [==============================] - 0s 25us/step
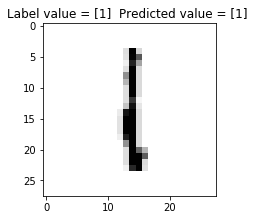
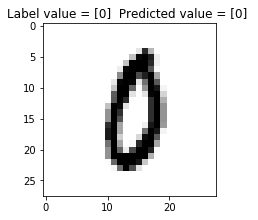
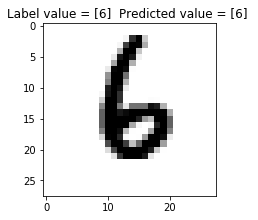
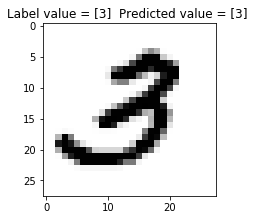
0.2771936253398657 0.92239999771118161 2 3 4 5 6 7 8 9 10 11 12 13 14 15 16 import numpyfor index in numpy.random.choice(len(y_test), 3 , replace = False ): predicted = model.predict(X_test[index:index + 1 ])[0 ] label = y_test[index] result_label = numpy.where(label == numpy.amax(label)) result_predicted = numpy.where(predicted == numpy.amax(predicted)) title = "Label value = %s Predicted value = %s " % (result_label[0 ], result_predicted[0 ]) fig = plt.figure(1 , figsize = (3 ,3 )) ax1 = fig.add_axes((0 ,0 ,.8 ,.8 )) ax1.set_title(title) images = X_test plt.imshow(images[index].reshape(28 , 28 ), cmap = 'Greys' , interpolation = 'nearest' ) plt.show()
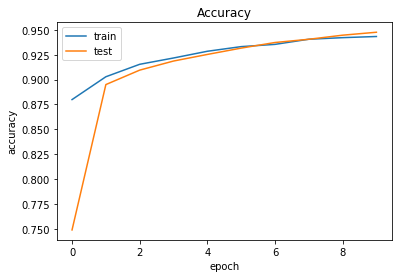
1 2 3 4 5 6 7 8 9 10 11 12 13 14 import matplotlib.pyplot as pltplt.plot(history.history['val_accuracy' ]) plt.plot(history.history['accuracy' ]) plt.title('Accuracy' ) plt.xlabel('epoch' ) plt.ylabel('accuracy' ) plt.legend(['train' , 'test' ], loc='upper left' ) plt.show()
실습3 이번에는 실제로 CNN을 사용하여 딥러닝을 수행했다. MLT를 수행하기 이전에 Convolution Layer 및 Pooling Layer를 거쳐 학습이 진행된다.
2019.11.24. 딥-러닝 과정 CNN 두번째 실습. Keras 모델 생성/학습 - MNIST : CNN Keras Dataset
1 2 3 4 5 6 7 8 9 10 11 12 13 14 from keras.datasets import mnistfrom sklearn.model_selection import train_test_split(X_train, y_train), (X_test, y_test) = mnist.load_data() X_train, X_val, y_train, y_val = train_test_split(X_train, y_train, test_size=0.2 , random_state=9 ) print(X_train.shape) print(y_train.shape) print(X_test.shape) print(y_test.shape)
(48000, 28, 28)
(48000,)
(10000, 28, 28)
(10000,)1 2 3 4 5 6 import matplotlib.pyplot as pltimage = X_train[2 ] plt.imshow(image, cmap=plt.cm.gray)
<matplotlib.image.AxesImage at 0x240c6b78c48>1 2 3 4 5 6 7 8 9 10 11 12 13 14 X_train = X_train.reshape(48000 , 28 , 28 , 1 ) X_val = X_val.reshape(12000 , 28 ,28 ,1 ) X_test = X_test.reshape((10000 , 28 , 28 , 1 )) print(X_train.shape) print(X_val.shape) print(X_test.shape)
(48000, 28, 28, 1)
(12000, 28, 28, 1)
(10000, 28, 28, 1)1 2 3 4 X_train = X_train / 255.0 X_val = X_val / 255.0 X_test = X_test / 255.0
1 2 3 4 5 6 7 8 9 10 print(y_train[:10 ]) from keras.utils import to_categoricaly_train = to_categorical(y_train) y_val = to_categorical(y_val) y_test = to_categorical(y_test) print(y_train[:10 ])
[9 9 9 5 3 2 0 4 2 7]
[[0. 0. 0. 0. 0. 0. 0. 0. 0. 1.]
[0. 0. 0. 0. 0. 0. 0. 0. 0. 1.]
[0. 0. 0. 0. 0. 0. 0. 0. 0. 1.]
[0. 0. 0. 0. 0. 1. 0. 0. 0. 0.]
[0. 0. 0. 1. 0. 0. 0. 0. 0. 0.]
[0. 0. 1. 0. 0. 0. 0. 0. 0. 0.]
[1. 0. 0. 0. 0. 0. 0. 0. 0. 0.]
[0. 0. 0. 0. 1. 0. 0. 0. 0. 0.]
[0. 0. 1. 0. 0. 0. 0. 0. 0. 0.]
[0. 0. 0. 0. 0. 0. 0. 1. 0. 0.]]1 2 3 4 5 6 7 8 9 10 11 12 13 14 15 16 from keras.models import Sequentialfrom keras.layers import Dense, Conv2D, MaxPooling2D, Flattenmodel = Sequential() model.add(Conv2D(filters=32 , kernel_size=(3 ,3 ), padding='same' , activation='relu' , input_shape=(28 , 28 , 1 ))) model.add(MaxPooling2D(pool_size=(2 ,2 ))) model.add(Flatten()) model.add(Dense(128 , activation='relu' )) model.add(Dense(10 , activation='softmax' )) print(model.summary())
Model: "sequential_10"
_________________________________________________________________
Layer (type) Output Shape Param #
=================================================================
conv2d_9 (Conv2D) (None, 28, 28, 32) 320
_________________________________________________________________
max_pooling2d_7 (MaxPooling2 (None, 14, 14, 32) 0
_________________________________________________________________
flatten_6 (Flatten) (None, 6272) 0
_________________________________________________________________
dense_9 (Dense) (None, 128) 802944
_________________________________________________________________
dense_10 (Dense) (None, 10) 1290
=================================================================
Total params: 804,554
Trainable params: 804,554
Non-trainable params: 0
_________________________________________________________________
None1 2 3 4 model.compile(loss='categorical_crossentropy' , optimizer='sgd' , metrics=['accuracy' ])
1 2 3 4 5 6 7 8 9 10 batch_size=128 epochs=10 history = model.fit(X_train, y_train, epochs=epochs, batch_size=batch_size, validation_data=(X_val, y_val), verbose=1 )
W1124 16:01:22.815376 23724 deprecation_wrapper.py:119] From c:\users\kyu93\appdata\local\programs\python\python37\lib\site-packages\keras\backend\tensorflow_backend.py:422: The name tf.global_variables is deprecated. Please use tf.compat.v1.global_variables instead.
Train on 48000 samples, validate on 12000 samples
Epoch 1/10
48000/48000 [==============================] - 10s 203us/step - loss: 1.1062 - accuracy: 0.7491 - val_loss: 0.4400 - val_accuracy: 0.8799
Epoch 2/10
48000/48000 [==============================] - 10s 207us/step - loss: 0.3706 - accuracy: 0.8950 - val_loss: 0.3396 - val_accuracy: 0.9028
Epoch 3/10
48000/48000 [==============================] - 12s 242us/step - loss: 0.3099 - accuracy: 0.9095 - val_loss: 0.3000 - val_accuracy: 0.9153
Epoch 4/10
48000/48000 [==============================] - 12s 245us/step - loss: 0.2787 - accuracy: 0.9186 - val_loss: 0.2750 - val_accuracy: 0.9217
Epoch 5/10
48000/48000 [==============================] - 12s 244us/step - loss: 0.2548 - accuracy: 0.9252 - val_loss: 0.2543 - val_accuracy: 0.9284
Epoch 6/10
48000/48000 [==============================] - 12s 252us/step - loss: 0.2348 - accuracy: 0.9316 - val_loss: 0.2379 - val_accuracy: 0.9331
Epoch 7/10
48000/48000 [==============================] - 12s 251us/step - loss: 0.2173 - accuracy: 0.9372 - val_loss: 0.2233 - val_accuracy: 0.9353
Epoch 8/10
48000/48000 [==============================] - 13s 269us/step - loss: 0.2025 - accuracy: 0.9405 - val_loss: 0.2106 - val_accuracy: 0.9405
Epoch 9/10
48000/48000 [==============================] - 13s 265us/step - loss: 0.1898 - accuracy: 0.9446 - val_loss: 0.1987 - val_accuracy: 0.9421
Epoch 10/10
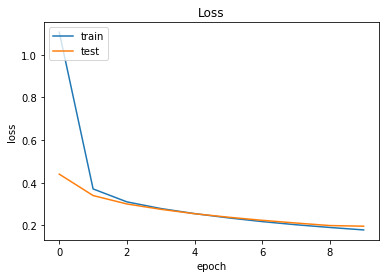
48000/48000 [==============================] - 12s 251us/step - loss: 0.1782 - accuracy: 0.9475 - val_loss: 0.1957 - val_accuracy: 0.94331 2 test_loss, test_acc = model.evaluate(X_test, y_test)
10000/10000 [==============================] - 1s 83us/step1 2 3 4 5 6 7 8 9 10 11 12 13 14 15 16 import numpyfor index in numpy.random.choice(len(y_test), 3 , replace = False ): predicted = model.predict(X_test[index:index + 1 ])[0 ] label = y_test[index] result_label = numpy.where(label == numpy.amax(label)) result_predicted = numpy.where(predicted == numpy.amax(predicted)) title = "Label value = %s Predicted value = %s " % (result_label[0 ], result_predicted[0 ]) fig = plt.figure(1 , figsize = (3 ,3 )) ax1 = fig.add_axes((0 ,0 ,.8 ,.8 )) ax1.set_title(title) images = X_test plt.imshow(images[index].reshape(28 , 28 ), cmap = 'Greys' , interpolation = 'nearest' ) plt.show()
1 2 3 4 5 6 7 8 9 10 11 12 13 14 15 16 17 plt.plot(history.history['val_accuracy' ]) plt.plot(history.history['accuracy' ]) plt.title('Accuracy' ) plt.xlabel('epoch' ) plt.ylabel('accuracy' ) plt.legend(['train' , 'test' ], loc='upper left' ) plt.show() plt.plot(history.history['loss' ]) plt.plot(history.history['val_loss' ]) plt.title('Loss' ) plt.xlabel('epoch' ) plt.ylabel('loss' ) plt.legend(['train' , 'test' ], loc='upper left' ) plt.show()
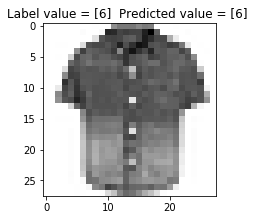
실습4 위에서 학습한 방식을 그대로 사용하여 Fashion MNIST 데이터에 적용하여 딥러닝을 수행해보았다.
2019.11.24. 딥-러닝 과정 CNN 세번째 실습. Keras 모델 생성/학습 - Fashion MNIST : CNN Keras Dataset
1 2 3 4 5 6 7 8 9 10 11 12 13 14 15 16 from keras.datasets import fashion_mnistfrom sklearn.model_selection import train_test_split(X_train, y_train), (X_test, y_test) = fashion_mnist.load_data() X_train, X_val, y_train, y_val = train_test_split(X_train, y_train, test_size=0.2 , random_state=9 ) print(X_train.shape) print(y_train.shape) print(X_val.shape) print(y_val.shape) print(X_test.shape) print(y_test.shape)
(48000, 28, 28)
(48000,)
(12000, 28, 28)
(12000,)
(10000, 28, 28)
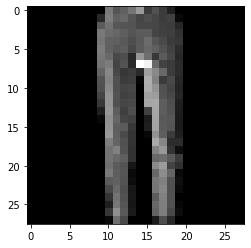
(10000,)1 2 3 4 5 6 import matplotlib.pyplot as pltimage = X_train[1 ] plt.imshow(image, cmap = plt.cm.gray)
<matplotlib.image.AxesImage at 0x2ab820aac08>1 2 3 4 5 6 7 8 X_train = X_train.reshape(48000 , 28 , 28 , 1 ) X_val = X_val.reshape(12000 , 28 , 28 , 1 ) X_test = X_test.reshape(10000 , 28 , 28 , 1 ) print(X_train.shape) print(X_val.shape) print(X_test.shape)
(48000, 28, 28, 1)
(12000, 28, 28, 1)
(10000, 28, 28, 1)1 2 3 4 5 X_train = X_train / 255.0 X_val = X_val / 255.0 X_test = X_test / 255.0
1 2 3 4 5 6 7 8 9 print(y_train[:10 ]) from keras.utils import to_categoricaly_train = to_categorical(y_train) y_val = to_categorical(y_val) y_test = to_categorical(y_test) print(y_train[:10 ])
[3 1 2 6 7 3 5 1 1 5]
[[0. 0. 0. 1. 0. 0. 0. 0. 0. 0.]
[0. 1. 0. 0. 0. 0. 0. 0. 0. 0.]
[0. 0. 1. 0. 0. 0. 0. 0. 0. 0.]
[0. 0. 0. 0. 0. 0. 1. 0. 0. 0.]
[0. 0. 0. 0. 0. 0. 0. 1. 0. 0.]
[0. 0. 0. 1. 0. 0. 0. 0. 0. 0.]
[0. 0. 0. 0. 0. 1. 0. 0. 0. 0.]
[0. 1. 0. 0. 0. 0. 0. 0. 0. 0.]
[0. 1. 0. 0. 0. 0. 0. 0. 0. 0.]
[0. 0. 0. 0. 0. 1. 0. 0. 0. 0.]]1 2 3 4 5 6 7 8 9 10 11 12 13 14 15 16 17 18 from keras.models import Sequentialfrom keras.layers import Dense, Conv2D, MaxPool2D, Flatten, Dropoutmodel = Sequential() model.add(Conv2D(filters=32 , kernel_size=(3 ,3 ), padding='same' , activation='relu' , input_shape=(28 , 28 , 1 ))) model.add(MaxPool2D(pool_size=(2 , 2 ))) model.add(Flatten()) model.add(Dense(128 , activation='relu' )) model.add(Dropout(0.3 )) model.add(Dense(10 , activation='softmax' )) print(model.summary())
Model: "sequential_5"
_________________________________________________________________
Layer (type) Output Shape Param #
=================================================================
conv2d_5 (Conv2D) (None, 28, 28, 32) 320
_________________________________________________________________
max_pooling2d_5 (MaxPooling2 (None, 14, 14, 32) 0
_________________________________________________________________
flatten_5 (Flatten) (None, 6272) 0
_________________________________________________________________
dense_5 (Dense) (None, 128) 802944
_________________________________________________________________
dropout_2 (Dropout) (None, 128) 0
_________________________________________________________________
dense_6 (Dense) (None, 10) 1290
=================================================================
Total params: 804,554
Trainable params: 804,554
Non-trainable params: 0
_________________________________________________________________
None1 2 3 4 model.compile(loss='categorical_crossentropy' , optimizer='adam' , metrics=['accuracy' ])
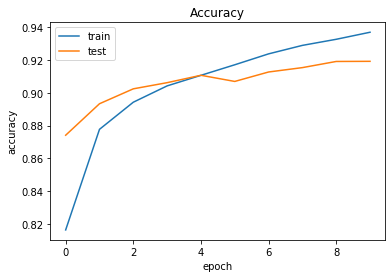
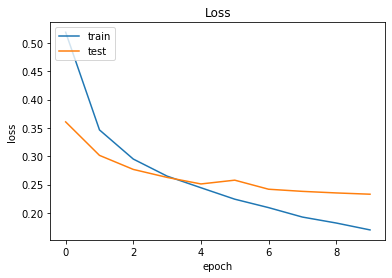
1 2 3 4 5 6 7 8 9 batch_size = 128 epochs = 10 history = model.fit(X_train, y_train, epochs=epochs, batch_size=batch_size, validation_data=(X_val, y_val), verbose=1 )
Train on 48000 samples, validate on 12000 samples
Epoch 1/10
48000/48000 [==============================] - 25s 511us/step - loss: 0.5189 - accuracy: 0.8164 - val_loss: 0.3606 - val_accuracy: 0.8741
Epoch 2/10
48000/48000 [==============================] - 23s 488us/step - loss: 0.3464 - accuracy: 0.8777 - val_loss: 0.3015 - val_accuracy: 0.8932
Epoch 3/10
48000/48000 [==============================] - 23s 487us/step - loss: 0.2950 - accuracy: 0.8942 - val_loss: 0.2767 - val_accuracy: 0.9023
Epoch 4/10
48000/48000 [==============================] - 23s 484us/step - loss: 0.2648 - accuracy: 0.9041 - val_loss: 0.2626 - val_accuracy: 0.9061
Epoch 5/10
48000/48000 [==============================] - 23s 480us/step - loss: 0.2444 - accuracy: 0.9106 - val_loss: 0.2510 - val_accuracy: 0.9106
Epoch 6/10
48000/48000 [==============================] - 23s 479us/step - loss: 0.2241 - accuracy: 0.9170 - val_loss: 0.2577 - val_accuracy: 0.9068
Epoch 7/10
48000/48000 [==============================] - 24s 503us/step - loss: 0.2093 - accuracy: 0.9236 - val_loss: 0.2417 - val_accuracy: 0.9126
Epoch 8/10
48000/48000 [==============================] - 24s 509us/step - loss: 0.1926 - accuracy: 0.9288 - val_loss: 0.2380 - val_accuracy: 0.9153
Epoch 9/10
48000/48000 [==============================] - 24s 504us/step - loss: 0.1821 - accuracy: 0.9325 - val_loss: 0.2352 - val_accuracy: 0.9190
Epoch 10/10
48000/48000 [==============================] - 24s 506us/step - loss: 0.1699 - accuracy: 0.9368 - val_loss: 0.2329 - val_accuracy: 0.91911 2 test_loss, test_acc = model.evaluate(X_test, y_test)
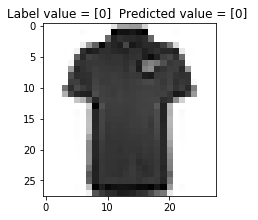
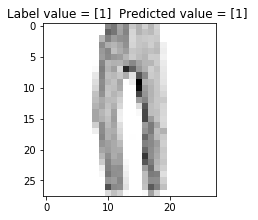
10000/10000 [==============================] - 2s 206us/step1 2 3 4 5 6 7 8 9 10 11 12 13 14 15 import numpyfor index in numpy.random.choice(len(y_test), 3 , replace = False ): predicted = model.predict(X_test[index:index + 1 ])[0 ] label = y_test[index] result_label = numpy.where(label == numpy.amax(label)) result_predicted = numpy.where(predicted == numpy.amax(predicted)) title = "Label value = %s Predicted value = %s " % (result_label[0 ], result_predicted[0 ]) fig = plt.figure(1 , figsize = (3 ,3 )) ax1 = fig.add_axes((0 ,0 ,.8 ,.8 )) ax1.set_title(title) images = X_test plt.imshow(images[index].reshape(28 , 28 ), cmap = 'Greys' , interpolation = 'nearest' ) plt.show()
1 2 3 4 5 6 7 8 9 10 11 12 13 14 15 16 17 plt.plot(history.history['accuracy' ]) plt.plot(history.history['val_accuracy' ]) plt.title('Accuracy' ) plt.xlabel('epoch' ) plt.ylabel('accuracy' ) plt.legend(['train' , 'test' ], loc='upper left' ) plt.show() plt.plot(history.history['loss' ]) plt.plot(history.history['val_loss' ]) plt.title('Loss' ) plt.xlabel('epoch' ) plt.ylabel('loss' ) plt.legend(['train' , 'test' ], loc='upper left' ) plt.show()
실습5 마지막으로 cifar10 데이터셋에 대한 이미지 분류(Image Classification)를 수행하는 Convolutional Neural Networks(CNNs)을 만드는 예제를 수행하였다..
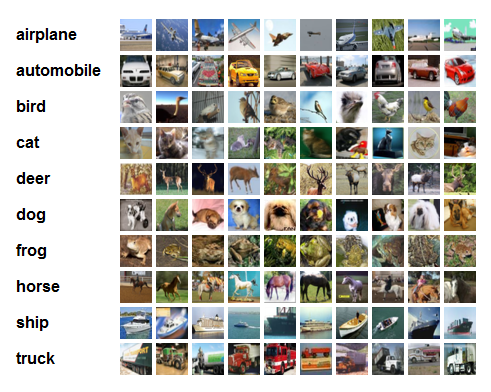
CIFAR-10은 이미지 인식 분야에서 널리 쓰이는 벤치마크 데이터셋 중 하나이다. CIFAR-10 데이터셋은 아래와 같이 총 10개의 레이블로 이루어져 있다.
airplane, automobile, bird, cat, deer, dog, frog, horse, ship, and truck.
각각의 레이블마다 32×32 크기 이미지인 50,000개의 training 데이터셋, 10,000개의 test 데이터셋이 존재하고, 결과적으로 총 60,000개의 32×32 크기의 이미지로 데이터셋이 구성되어 있다.
2019.11.24. 딥-러닝 과정 CNN 네번째 실습. Keras 모델 생성/학습 - cifar10 : CNN Keras Dataset
1 2 3 4 5 6 7 8 9 10 11 12 13 14 15 16 from keras.datasets import cifar10from sklearn.model_selection import train_test_split(X_train, y_train), (X_test, y_test) = cifar10.load_data() X_train, X_val, y_train, y_val = train_test_split(X_train, y_train, test_size=0.2 , random_state=9 ) print(X_train.shape) print(y_train.shape) print(X_val.shape) print(y_val.shape) print(X_test.shape) print(y_test.shape)
(40000, 32, 32, 3)
(40000, 1)
(10000, 32, 32, 3)
(10000, 1)
(10000, 32, 32, 3)
(10000, 1)1 2 3 4 5 6 import matplotlib.pyplot as pltimage = X_train[2 ] plt.imshow(image)
<matplotlib.image.AxesImage at 0x2a31e4ed948>1 2 3 4 X_train = X_train / 255.0 X_val = X_val / 255.0 X_test = X_test / 255.0
1 2 3 4 5 6 7 8 9 from keras.utils import to_categoricaly_train = to_categorical(y_train) y_val = to_categorical(y_val) y_test = to_categorical(y_test) print(y_train[:10 ])
[[0. 0. 0. 0. 0. 0. 0. 0. 0. 1.]
[0. 0. 0. 0. 0. 0. 0. 0. 1. 0.]
[0. 0. 0. 0. 0. 0. 0. 0. 0. 1.]
[0. 0. 0. 1. 0. 0. 0. 0. 0. 0.]
[0. 1. 0. 0. 0. 0. 0. 0. 0. 0.]
[0. 0. 0. 0. 0. 0. 0. 0. 1. 0.]
[0. 0. 0. 1. 0. 0. 0. 0. 0. 0.]
[0. 0. 1. 0. 0. 0. 0. 0. 0. 0.]
[0. 0. 0. 0. 0. 1. 0. 0. 0. 0.]
[0. 0. 0. 0. 0. 1. 0. 0. 0. 0.]]1 2 3 4 5 6 7 8 9 10 11 12 13 14 15 16 17 18 19 20 21 22 from keras.models import Sequentialfrom keras.layers import Dropout, Dense, Conv2D, MaxPooling2D, Flattenmodel = Sequential() model.add(Conv2D(filters=32 , kernel_size=(3 ,3 ), padding='same' , activation='relu' , input_shape=(32 , 32 , 3 ))) model.add(Conv2D(64 , (3 ,3 ), padding='same' , activation='relu' )) model.add(MaxPooling2D(pool_size=(2 ,2 ))) model.add(Flatten()) model.add(Dense(128 , activation='relu' )) model.add(Dropout(0.3 )) model.add(Dense(64 , activation='relu' )) model.add(Dropout(0.2 )) model.add(Dense(10 , activation='softmax' )) print(model.summary())
Model: "sequential_7"
_________________________________________________________________
Layer (type) Output Shape Param #
=================================================================
conv2d_10 (Conv2D) (None, 32, 32, 32) 896
_________________________________________________________________
conv2d_11 (Conv2D) (None, 32, 32, 64) 18496
_________________________________________________________________
max_pooling2d_7 (MaxPooling2 (None, 16, 16, 64) 0
_________________________________________________________________
flatten_7 (Flatten) (None, 16384) 0
_________________________________________________________________
dense_16 (Dense) (None, 128) 2097280
_________________________________________________________________
dropout_11 (Dropout) (None, 128) 0
_________________________________________________________________
dense_17 (Dense) (None, 64) 8256
_________________________________________________________________
dropout_12 (Dropout) (None, 64) 0
_________________________________________________________________
dense_18 (Dense) (None, 10) 650
=================================================================
Total params: 2,125,578
Trainable params: 2,125,578
Non-trainable params: 0
_________________________________________________________________
None1 2 3 4 model.compile(loss='categorical_crossentropy' , optimizer='adam' , metrics=['accuracy' ])
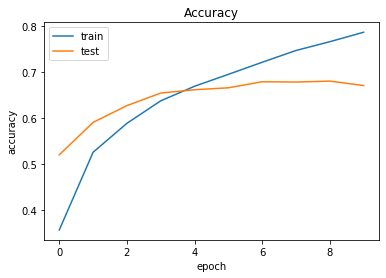
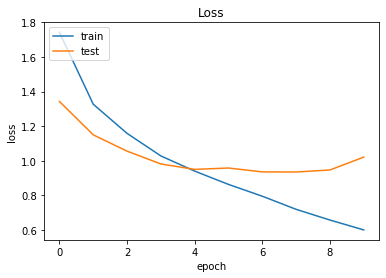
1 2 3 4 5 6 7 8 9 batch_size = 128 epochs = 10 history = model.fit(X_train, y_train, epochs=epochs, batch_size=batch_size, validation_data=(X_val, y_val), verbose=1 )
Train on 40000 samples, validate on 10000 samples
Epoch 1/10
40000/40000 [==============================] - 67s 2ms/step - loss: 1.7432 - accuracy: 0.3568 - val_loss: 1.3433 - val_accuracy: 0.5201
Epoch 2/10
40000/40000 [==============================] - 72s 2ms/step - loss: 1.3271 - accuracy: 0.5257 - val_loss: 1.1500 - val_accuracy: 0.5906
Epoch 3/10
40000/40000 [==============================] - 77s 2ms/step - loss: 1.1586 - accuracy: 0.5886 - val_loss: 1.0559 - val_accuracy: 0.6271
Epoch 4/10
40000/40000 [==============================] - 79s 2ms/step - loss: 1.0281 - accuracy: 0.6375 - val_loss: 0.9819 - val_accuracy: 0.6544
Epoch 5/10
40000/40000 [==============================] - 77s 2ms/step - loss: 0.9405 - accuracy: 0.6692 - val_loss: 0.9503 - val_accuracy: 0.6616
Epoch 6/10
40000/40000 [==============================] - 74s 2ms/step - loss: 0.8635 - accuracy: 0.6951 - val_loss: 0.9583 - val_accuracy: 0.6658
Epoch 7/10
40000/40000 [==============================] - 80s 2ms/step - loss: 0.7953 - accuracy: 0.7214 - val_loss: 0.9359 - val_accuracy: 0.6790
Epoch 8/10
40000/40000 [==============================] - 74s 2ms/step - loss: 0.7194 - accuracy: 0.7470 - val_loss: 0.9354 - val_accuracy: 0.6783
Epoch 9/10
40000/40000 [==============================] - 79s 2ms/step - loss: 0.6575 - accuracy: 0.7661 - val_loss: 0.9470 - val_accuracy: 0.6804
Epoch 10/10
40000/40000 [==============================] - 76s 2ms/step - loss: 0.6005 - accuracy: 0.7867 - val_loss: 1.0215 - val_accuracy: 0.67071 2 test_loss, test_acc = model.evaluate(X_test, y_test)
10000/10000 [==============================] - 5s 517us/step1 2 3 4 5 6 7 8 9 10 11 12 13 14 15 import numpyfor index in numpy.random.choice(len(y_test), 3 , replace = False ): predicted = model.predict(X_test[index:index + 1 ])[0 ] label = y_test[index] result_label = numpy.where(label == numpy.amax(label)) result_predicted = numpy.where(predicted == numpy.amax(predicted)) title = "Label value = %s Predicted value = %s " % (result_label[0 ], result_predicted[0 ]) fig = plt.figure(1 , figsize = (3 ,3 )) ax1 = fig.add_axes((0 ,0 ,.8 ,.8 )) ax1.set_title(title) images = X_test plt.imshow(images[index], interpolation = 'nearest' ) plt.show()
1 2 3 4 5 6 7 8 9 10 11 12 13 14 15 16 17 plt.plot(history.history['accuracy' ]) plt.plot(history.history['val_accuracy' ]) plt.title('Accuracy' ) plt.xlabel('epoch' ) plt.ylabel('accuracy' ) plt.legend(['train' , 'test' ], loc='upper left' ) plt.show() plt.plot(history.history['loss' ]) plt.plot(history.history['val_loss' ]) plt.title('Loss' ) plt.xlabel('epoch' ) plt.ylabel('loss' ) plt.legend(['train' , 'test' ], loc='upper left' ) plt.show()
참조https://umbum.tistory.com/223 https://untitledtblog.tistory.com/150 https://adeshpande3.github.io/A-Beginner%27s-Guide-To-Understanding-Convolutional-Neural-Networks/ http://solarisailab.com/archives/1700

